

Source: photo by Lucas Conwell
Introduction
Bus rapid transit (BRT) systems have received ample attention in recent years for their ability to offer travel time reductions and mobility benefits comparable to those of rail transit for less than one third of the cost. One major argument for investing in BRT lines, which incorporate subway-like features such as separate rights of way, long articulated buses, and stations with pre-boarding fare payment (Gilbert 2008; Hidalgo and Gutierrez 2013), holds that they overcome the stigma often associated with bus use and therefore attract new transit riders who formerly drove, thereby reducing congestion and greenhouse gas emissions. This study tests the ability of BRT upgrades to convince drivers to switch to transit by conducting an intercept survey of riders on the VIVA Yellow BRT line in Newmarket, Ontario, which opened about 5 months before the study.
Literature
Previous studies in urban planning come to a variety of conclusions as to the ability of BRT to cause mode shift. One set of papers uses econometric mode choice models, which estimate a regression to explain the probability of choosing each mode of transportation using demographic, built environment, and modal characteristics, to evaluate the impact of transit upgrades. This branch of research finds, among other conclusions, that riders of the new TransMilenio BRT in Bogota, Colombia perceive time spent riding the new BRT as less costly, and thus will stomach longer waiting and walking times in order to use the system, even if additional transfers might actually make the trip longer than on the old bus system (Lleras 2003). Additionally, TransMilenio succeeded in reducing car ownership among lowincome households in dense neighborhoods with high levels of mixed-use development (Combs and Rodriguez 2014).
Similarly, a study using panel survey data and discrete mode choice models finds that commuters whose bus travel time was reduced by at least 10 minutes by the opening of the Fastway BRT outside London were significantly more likely to take the bus (Chatterjee 2010). Simulations as part of a 2011 study of the existing VIVA system based on a discrete choice model in fact found that the effect of transit improvements on commute mode share outweighs the effect of congestion by up to a factor of nine (Forsey et al. 2013).
However, this conclusion is far from unanimous in the literature. Discrete choice modeling using panel household travel survey data from Chennai, India shows that the accessibility of transit positively influences the probability of transit use only for workers who relocated into the catchment area of transit stops (Srinivasan and Bhargavi 2007). According to Cao and Schoner (2014), existing residents of the new Hiawatha light rail corridor in Minneapolis, MN increased their transit use less than commonly assumed; furthermore, commuters who relocated into the vicinity of stations rarely take light rail, possibly because of the lack of pedestrian infrastructure around stations.
Finally, a panel survey of Santiago residents both before and after the implementation of the new Transantiago bus and metro system in Santiago, Chile, found that most new low-income metro riders are former bus riders; in addition, the percentage of high income residents commuting using cars and other “private modes” actually rose after the system’s opening (Yáñez, Mansilla, and Dios Ortúzar 2010). Thus, while many evaluations of transit improvements do find appreciable impacts on travel behavior, these effects clearly merit further investigation.
VIVA Yellow
Figure 1: Newmarket, Ontario

Source: “Toronto Cleaning Services – Service Area.”
The VIVA Yellow line is the second stage of the VivaNext project, which will eventually be extended into an extensive bus rapid transit network in the York Region in suburban Toronto. The VIVA Yellow line runs east-west along Davis Drive, a main suburban arterial in Newmarket, an outer ring suburb a full 30 miles north of downtown Toronto.
The line begins at the Newmarket Bus Terminal at the western end of the municipality, which offers bus connections to other local VIVA and York Region Transit lines as well as GO Transit lines to Toronto and other regional destinations. From Yonge Street (just east of the Newmarket Terminal) to Roxborough
Road (just east of the Southlake stop), 1.6 miles to the east, VIVA Yellow runs in a dedicated “Rapidway.” The line then runs another 1.43 miles in mixed traffic to a park and ride lot at Highway 404, a major regional transportation artery (“Davis Drive/Newmarket”; “Presentation Boards”).
Figure 2: Viva Yellow bus rapid transit map

Source: “Maps by municipality: Newmarket-Aurora.”
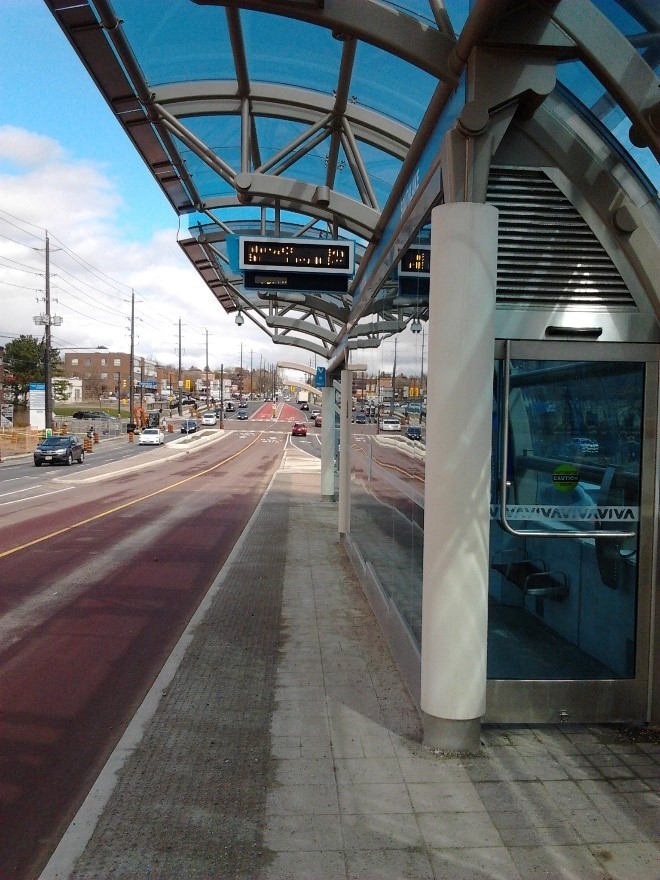
The Rapidway, which opened along with the rebranded line on Nov. 29, 2015 (Novakovic 2015) incorporates dedicated red-painted bus lanes, pedestrian and streetscape improvements, as well as elaborate stations. These three “Vivastations” feature futuristic glass canopies, heated waiting areas, real-time arrival information screens, and fare machines to allow pre-payment (“Presentation Boards”). Additionally buses receive transit signal priority at intersections (“Viva BRT service opens in Newmarket, Ont.”).
Figure 3: Southlake Vivastation

Source: photo by Lucas Conwell
Figure 4: Off-board fare pre-payment at Southlake

Source: photo by Lucas Conwell
Even the more simple curbside stops outside of the Rapidway at Huron Heights, Leslie, and Hwy 404 feature modern glass shelters with fare machines and real-time information screens.
Figure 5. Leslie curbside stop

Source: photo by Lucas Conwell
VIVA Yellow uses brand new vehicles shorter than the articulated buses used on other VIVA routes; these vehicles are fully adequate to cover the present levels of ridership.
Figure 6: VIVA Yellow bus

Source: photo by Lucas Conwell
VIVA Yellow is highly unusual among BRT systems in that it runs through a low density, suburban, historically car-dependent area (Novakovic 2015); thus, finding that VIVA Yellow has done little to coax drivers out of their cars does not necessarily discount the effectiveness of BRT in more urban settings. On the other hand, its location makes the project a fascinating test of the impact of high quality transit on suburban travel.
Methodology
Originally, our two person survey team planned to follow a random sampling plan of VIVA Yellow stops, surveying passengers at a randomly selected station for one hour at a time from 2-6pm on Friday April 1st and 1-4pm on Saturday, April 2nd. Due to a lack of transit agency permission, we were unable to conduct surveys on board buses, which could have produced a higher response rate. Passenger numbers on Friday and Saturday were unexpectedly low, so low that we made the decision to abandon the random sampling plan in favor of focusing on stops that seemed to have the most passenger activity. Many of the stops selected in our random sampling plan were virtually devoid of any boardings or alightings, so following the plan would have depressed sample size so far as to make the results almost meaningless.
Initially, we planned to survey both boarding and alighting passengers, but alighting passengers proved extremely averse to our requests, so we instead focused on surveying passengers waiting to board the bus. Passenger numbers, even at the most frequented stops, were low enough that we did not have to use an “every n-th passenger” sampling method; instead, we asked every passenger waiting at the stop whether he or she would be willing to fill out a survey to help improve bus service. Even among these passengers – who would be waiting at the bus stop regardless of whether they chose to participate – response rates varied widely from stop to stop, from around 25% to 75%.
Not surprisingly, ridership was higher on Friday, and the distribution of the 29 surveys collected reflects this disparity.

The Leslie stop not only had reasonably high numbers of passengers, but these passengers also proved especially willing to participate, perhaps due to a type of snowball effect. Main, Southlake, and Newmarket also provided sizable numbers of survey respondents; the response rate at Newmarket was lower than its ridership numbers would suggest because the waiting bus seemed to encourage passengers to hurry on board even when overhead signs indicated that the bus would not leave for several minutes.

Results
Demographics
The educational distribution of passengers reveals that our sample does not only consist of low-income riders; a full 38% possess either a Bachelor’s or graduate/professional degree.

Correspondingly, our sample contains a surprisingly high number of car owners, given the usual demographic profile of suburban transit riders in North America. In fact, almost half own a car and so are, at least to some extent, riding VIVA Yellow by choice.

More than three-fourths of respondents were born in Canada; of those who selected “other,” only one reported the specific country.

The sample is also relatively young, with a median age of 27. Two respondents declined to report their age.

Trip characteristics
Respondents were also asked to report the primary purpose of their trip; while we intended for them to select only one response, many selected multiple. Thus, we report the shares of trips for which the respondent selected each purpose. Around half of trips were made to commute to or from work, and almost as many involved errands or shopping. Just under a third were social or recreational trips, and a fourth were to or from school.

Almost two thirds of respondents walked to the stop where they boarded VIVA Yellow; 31% transferred from another bus to VIVA Yellow, while just under 10% were dropped off at the stop by car. Fewer respondents – just under half – walked from the stop where they left the VIVA Yellow bus to their final destination; virtually all others planned to transfer from VIVA Yellow to another bus, either VIVA, York Region Transit, or GO Transit.

Impact of BRT on mode shift
Despite the ambitious investments made in the VIVA Yellow BRT, the overwhelming majority of riders most frequently used the bus to make their current trip prior to November 2015, when VIVA Yellow opened. Once again, we intended for survey respondents to choose only one mode they used “most frequently,” but a minority selected multiple. We report the exact responses below.
Beyond the 83% who selected “bus” when asked which mode they used most frequently to make this trip prior to Nov. 2015, 7% selected only “walk,” and 3% reported driving alone or with family (as distinct from carpooling).[1] One respondent reported taking the bus and driving alone prior to Nov. 2015, and one further respondent selected walking, biking, and driving alone. Perhaps these respondents intended to indicate that they sometimes used each mode selected, or they actually drove to the bus stop, parked, and then took the bus.

In any case, 90% of respondents reported walking or taking the bus before the opening of VIVA Yellow to make the same trip they were currently making. Thus, only 10% of surveyed VIVA Yellow riders might have driven instead of taking transit before the BRT improvements, and most of these so-called drivers seem to also have used other modes at least some of the time. Based on this admittedly small sample, the VIVA Yellow BRT upgrades seem to have played only a minimal role in shifting drivers onto transit.
Conclusion
Our survey of 29 VIVA Yellow riders suggests that fewer than 10% of riders would have driven before the completion of BRT upgrades; these results suggest that BRT, at least in the suburban context of Newmarket, has little potential to alter drivers’ commuting behavior, take cars off the road, or reduce transportation emissions.
Certainly, this simple survey did not account for other factors, such as rising incomes, which might have counteracted the effect of BRT, but it seems unlikely that any such confounding factors would have changed enough in the span of five months to alter aggregate commuting patterns. More importantly, a sample of 29 riders is certainly much smaller than optimal. However, the share of former bus riders is so high that it seems unlikely that a larger sample would include a substantial number of former drivers.
Accepting that VIVA Yellow did not have a significant impact on area residents’ mode choices does not necessarily mean that BRT in more urban contexts could not do better. Indeed, VIVA Yellow runs along a suburban arterial where the car-oriented layout of businesses and streetscapes as well as the low residential density create a hostile environment for transit. Building a similarly high quality line in Toronto or one of its more densely populated inner ring suburbs could yield vastly different results. VIVA planners clearly recognize that transit crucially depends on conducive land uses, as plans to encourage urban growth and density along Davis Drive reflect (“Presentation Boards”). In any case, improving and speeding the trips of those who choose or have no choice but to take the bus is a worthy goal in and of itself.
References
- Cao, Xinyu (Jason), and Jessica Schoner. 2014. “The Influence of Light Rail Transit on Transit Use:An Exploration of Station Area Residents along the Hiawatha Line in Minneapolis.” Transportation Research Part A: Policy and Practice 59 (January): 134–43. doi:10.1016/j.tra.2013.11.001.
- Chatterjee, Kiron. 2010. “Modelling the Dynamics of Bus Use in a Changing Travel Environment Using Panel Data.” Transportation 38 (3): 487–509. doi:10.1007/s11116-010-9312-y.
- Combs, Tabitha S., and Daniel A. Rodriguez. 2014. “Joint Impacts of Bus Rapid Transit and Urban Form on Vehicle Ownership: New Evidence from a Quasi-Longitudinal Analysis in Bogota, Colombia.” Transportation Research: Part A: Policy and Practice 69: 272–85. doi:http://dx.doi.org/10.1016/j.tra.2014.08.025.
- “Davis Drive/Newmarket.” VIVANext. York Region Rapid Transit Corporation. 2016. http://www.vivanext.com/davis-drive-newmarket
- Forsey, David, Khandker Nurul Habib, Eric J. Miller, and Amer Shalaby. 2013. “Evaluating the Impacts of a
- New Transit System on Commuting Mode Choice Using a GEV Model Estimated to Revealed Preference Data: A Case Study of the VIVA System in York Region, Ontario.” Transportation Research: Part A: Policy and Practice 50: 1–14. doi:http://dx.doi.org/10.1016/j.tra.2013.01.033.
- Gilbert, Alan. 2008. “Bus Rapid Transit: Is Transmilenio a Miracle Cure?” Transport Reviews 28 (4): 439– 67. doi:http://dx.doi.org/10.1080/01441640701785733.
- Hidalgo, Dario, and Luis Gutierrez. 2013. “BRT and BHLS around the World: Explosive Growth, Large Positive Impacts and Many Issues Outstanding.” Research in Transportation Economics 39 (1): 8–13. doi:http://dx.doi.org/10.1016/j.retrec.2012.05.018.
- Lleras, German Camilo. 2003. “Bus Rapid Transit: Impacts on Travel Behavior in Bogota.” Master’s Thesis, Cambridge: Massachusetts Institute of Technology.
- “Maps by municipality: Newmarket-Aurora.” York Region Rapid Transit Corporation. April 17, 2016. http://www.yrt.ca/en/schedulesmaps/resources/Newmarket_Aurora_Apr2016.pdf.
- Novakovic, Stefan. “Viva’s Davis Drive Now Open in Newmarket.” UrbanToronto.ca. December 10, 2015. http://urbantoronto.ca/news/2015/12/vivas-davis-drive-rapidway-now-open-newmarket.
- “Presentation Boards.” VIVANext. York Region Rapid Transit Corporation. May 13, 2015. http://www.vivanext.com/files/PastMeetings/DavisDrive_Newmarket/01_36_PCC_board_lores_05_12_ 2015.pdf.
- Srinivasan, Karthik K., and P. Bhargavi. 2007. “Longer-Term Changes in Mode Choice Decisions inChennai: A Comparison between Cross-Sectional and Dynamic Models.” Transportation 34 (3): 355– 74. doi:http://dx.doi.org/10.1007/s11116-007-9116-x.
- “Toronto Cleaning Services – Service Area.” Marathon Cleaning. http://www.marathoncleaning.ca/cleaning-services-locations.html.
- “Viva BRT service opens in Newmarket, Ont.” Metro Magazine. December 1, 2015. http://www.metromagazine.com/bus/news/411345/viva-brt-service-opens-in-newmarket-ont.
- Yáñez, Maria Francisca, Patricio Mansilla, and Juan de Dios Ortúzar. 2010. “The Santiago Panel:
- Measuring the Effects of Implementing Transantiago.” Transportation 37 (1): 125–49. doi:http://dx.doi.org/10.1007/s11116-009-9223-y.
Survey instrument

[1] Three respondents selected “bus” and “walk;” we include these with the bus-only responses, as we assume that they meant that they walked to the bus stop and then took the bus. Thus, bus would still be the primary mode.
My name is Lucas Conwell, and I’m a senior at Tufts University majoring in Quantitative Economics and minoring in Urban Studies. My focus is on transportation economics and planning, and I’ve had the opportunity pursue my passion for sustainable transportation through internships at German Railways (DB), the Massachusetts Smart Growth Alliance, and most recently, the Volpe National Transportation Systems Center in Boston.
Leave a Reply